Eco-systemic accounting, an example of R&D at ONF International


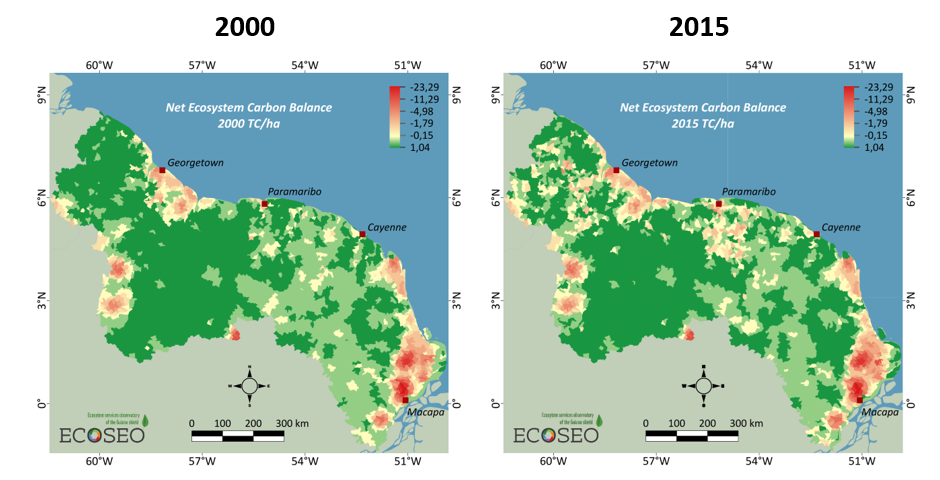
Maps of the net ecosystem carbon balance in 2000 and 2015 on the Guiana Shield (in TC/ha)
Since the 2000s, the concept of ecosystem services has reinforced the importance of preserving natural resources and landscape units in political decision-making. In 2010, the Convention on Biological Diversity (CBD) adopted a Strategic Plan for Biodiversity for the period 2011-2020, including the 20 “Aichi Targets”. Among these, Goal 2 commits member countries to integrate biodiversity values into their national accounts, using an ecosystem approach.
Since 2018, ONF International has been implementing projects to support countries in achieving this goal.
Our applied research focused on the application of the Ecosystemic Natural Capital Accounting (ENCA)[1] methodology, whose guidelines were published by the same CBD in 2014. The controversial anthropocentric term Natural Capital should be understood as any stock with the capacity to generate a flow of goods and services that benefit humanity.
The ENCA is a global approach, applicable to all ecosystems, whether natural or modified by human activities. It is a decision-making tool for public authorities and stakeholders in general, providing a cartographic representation of the evolution over time of the capacity of ecosystems to provide their services.
It is based on a combination of Biomass/Carbon, Water and Ecosystem Infrastructure functional services (land and rivers) accounts including biodiversity, each with its own physical value unit. Each account is composed of the quantitative stock balance and sustainability indices. The latter incorporate resource use stress and qualitative diagnostics based on the assessment of ecosystem health.
To assess the ecological value of ecosystems and compare management systems with each other, the indices of the three components are combined into a composite index of ecological value called the Ecosystem Capability Unit (ECU). Stock measures and changes in ECU can be added together to calculate Total Ecosystem Capacity (TEC) i.e., its ability to provide all its services. Depending on the objectives pursued, the TEC can be generated at different levels of aggregation (by region, country, watershed, etc.), allowing comparison of the trend in ecosystem degradation on a spatio-temporal scale.
ONFI has so far applied the ECNA method at transnational and national levels:
- On the Guiana Shield (Guyana, Suriname, French Guiana and the State of Amapá in Brazil) through the ECOSEO project, “Observatory of Ecosystem Services of the Guiana Shield”, a regional cooperation initiative launched in March 2019, coordinated by WWF-France and co-financed by the European Union and the Guiana Water Board;
- On Gabon, in cooperation with IUCN, with funding from the latter.
During these studies, ONFI produced all the accounting tables and associated maps that illustrate the evolution over time of the capacity of ecosystems to provide various services. In the framework of these projects, only two dates were processed, which implies that one must be careful about the conclusions that can be drawn from the evolutions.
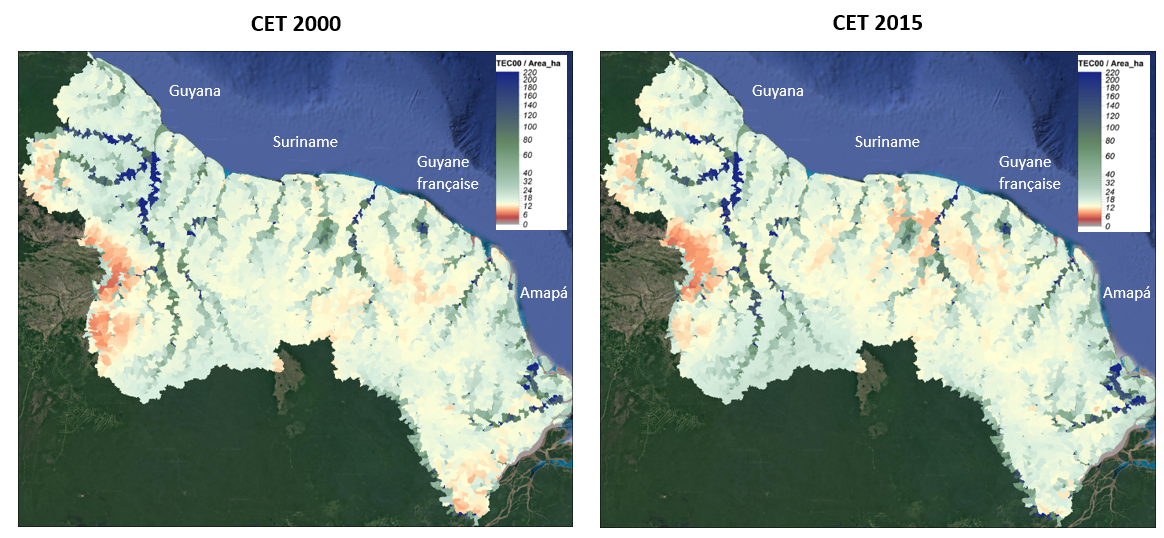
The maps below, provisional results of the ECOSEO project, illustrate the Total Ecosystem Capacity (TEC) measured at the watershed scale of the Guiana Shield for the years 2000 and 2015, as well as the evolution of changes in TEC over the period 2000-2015.


Regarding the map of changes 2000-2015:
- Values around 1, shown in grey, indicate a stable Total Ecosystem Capacity (TEC) between 2000 and 2015;
- Values below 1, shown in red to yellow, indicate a more or less sharp decline in TEC i.e., a deterioration in the capacity of ecosystems to provide their services;
- Values above 1, shown from dark green to light green, indicate a greater or lesser increase in TEC.
These results, which are still provisional but already encouraging – and which could allow future applications on a finer scale of analysis – will be the subject of more in-depth analyses later in order to be published ahead of the IUCN World Conservation Congress in Marseille in autumn 2021. Indeed, the ECOSEO project aims to demonstrate the importance of the region’s natural capital, notably through its evaluation using the ENCA method, developed by a French academic, Jean Louis Weber. This project also aims to promote cooperation between state institutions, NGOs, and other conservation actors to better preserve the region’s ecosystems and their services.

